Index
Digital analytics is the process of measuring, collecting, analyzing and presenting data to understand and improve the online user experience, increase the effectiveness of digital marketing strategies and make better overall business decisions.
Get the most out of your data: How to understand digital analytics
Evaluating the effectiveness of campaigns in digital analytics is critical to determining the success of marketing strategies.
Here are some key steps marketers can take to use digital analytics to make better decisions:
- Set clear objectives: The first step is to set clear objectives for the digital marketing strategy. These objectives should be specific, measurable, achievable, relevant and timely. For example, an objective could be to increase the conversion rate on a website by 15% in a given month.
- Select the right metrics: Once the objectives have been established, it is important to select the right metrics to measure progress towards those objectives. Metrics should be directly related to the established objectives and relevant to the type of campaign being executed. For example, metrics for a social media campaign might include the number of followers, reach and engagement.
- Collect and analyze data: It is critical to collect and analyze data using web and social media analytics tools to obtain valuable information. This will make it possible to evaluate the progress of the strategy and make adjustments on the fly if necessary.
- Identify patterns and trends: Once data has been collected, it is important to analyze it to identify patterns and trends that can provide valuable information to improve the marketing strategy. For example, user browsing patterns or customer preferences can be identified.
- Make informed decisions: Finally, the data collected and analyzed will help us make informed decisions. These decisions may include adjustments in marketing strategy, changes in audience segmentation or improvements in the online user experience.
Digital analytics is a valuable tool for making better decisions in digital marketing and business management in general. By setting clear objectives, selecting the right metrics, collecting and analyzing data, identifying patterns and trends, and making informed decisions, we can maximize the impact of our campaigns and improve the overall digital marketing strategy.
How digital analytics can improve the user experience on your website
All information collected by digital analytics tools may be used to improve the user experience on the website.
- Understand user behavior: Digital analytics allows to know how users interact with the website, such as which pages they visit the most, how much time they spend on the site, what actions they perform, among others. This information allows understanding the needs and expectations of users, which can help improve the user experience on the website.
- Identify problems on the website: It is also possible to identify problems on the website, such as pages that take too long to load, navigation errors, among others. By fixing these problems, the user’s experience on the website is improved.
- Personalization of content: We may learn about users’ preferences and behaviors, which may be used to personalize the content of the website. For example, relevant content may be shown to users based on their interests and previous behavior on the website.
- Improve navigation: Displays navigation patterns of users on the website. This can help improve site navigation, such as menu organization, button placement, among others.
- Conversion optimization: Helps identify friction points in the conversion process on the website, such as registration forms or completion of a purchase. By identifying these issues, improvements can be made to increase the conversion rate on the website.
By understanding user behavior, identifying website issues, personalizing content, improving navigation and optimizing conversion, it is possible to improve the user experience on a website.
But not only that! It allows us to better understand customers through the qualitative analysis of their data that tools such as Google Analytics or SemRush can offer us.
Digital analytics can be very useful to better understand your customers by knowing their needs and expectations, identifying trends and behavioral patterns, personalizing the user experience, identifying problems in the buying or conversion process and monitoring the performance of your marketing campaigns.
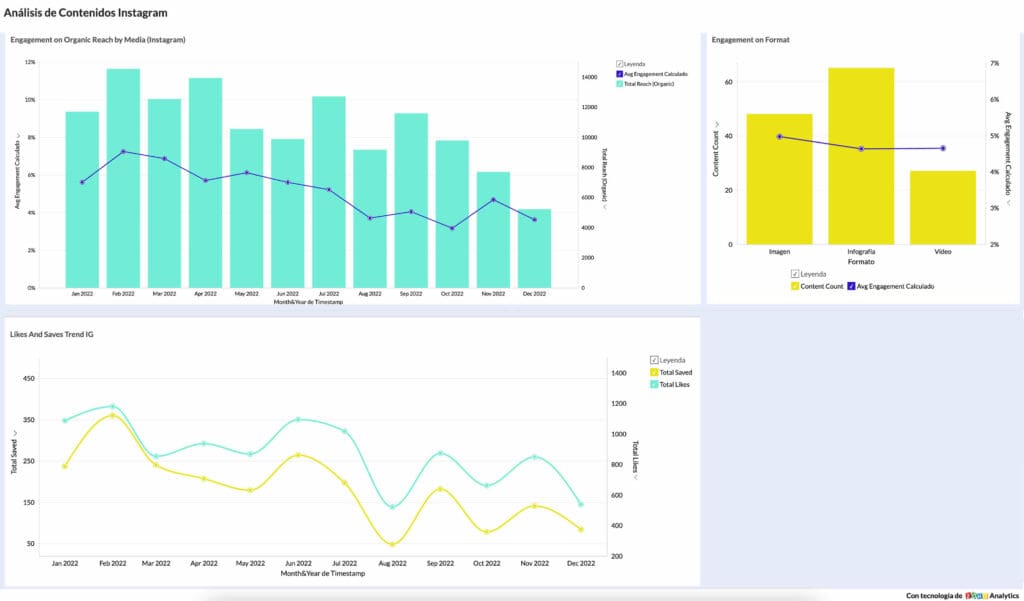
Dashboards to optimize campaign performance
Dashboards for digital analytics data collection are tools that allow you to visualize and analyze data collected from a website or application.
Here are some of the most commonly used dashboards for digital analytics data collection:
- Google Analytics: It is a free tool that allows you to analyze the traffic of a website. It provides a wealth of information about site visitors, including their geographic location, the devices they use, the pages they visit and the time they spend on the site. It also provides information on the keywords used to find the site, bounce rate and conversion rate.
- Adobe Analytics: Paid web analytics tool that provides detailed information about site visitors. It allows users to analyze website traffic in real time, as well as view trends and patterns in historical data. In addition, it offers a wide range of features for data analysis, such as segmentation, conversion funnel analysis and cohort analysis.
- Mixpanel: This web analytics tool is focused on event analytics. It allows users to track events that occur on the website, such as the creation of an account, the purchase of a product or the playback of a video. It also allows user segmentation and the creation of customized conversion funnels.
- Tableau: Allows users to create custom visualizations of data collected from a variety of sources, including web analytics tools such as Google Analytics and Adobe Analytics. Allows users to create custom dashboards and interactive visualizations that can be shared and collaborated with other users.
- Klipfolio: Business intelligence platform that allows users to create customized dashboards for data analytics from various sources, including web analytics tools. It offers a wide range of data visualization features and allows users to create custom dashboards and share them with other users.
- Zoho Analytics: Analytics and business intelligence platform that allows you to create custom dashboards for data analytics from various sources, including web analytics tools. It is a popular tool that allows users to connect to a wide variety of data sources, from databases and spreadsheets to web and third-party applications.
In addition, it has a wealth of features for data analysis, such as the creation of customized reports and dashboards, data segmentation, cohort analysis, conversion funnel creation and much more. It also offers a wide range of visualizations, such as charts, graphs, maps and gauges, allowing users to present data clearly and effectively.
By using these tools, users can gain valuable insights about site visitors, trends and patterns in the data, and opportunities to optimize the user experience and improve business results.
Watch our Analytics for Digital Marketing webinar!
Practical example: ecommerce conversion rate
Here’s a practical example of how you can measure product conversion rate in Google Analytics:
Let’s say you own an e-commerce website that sells electronic products, and you want to measure the conversion rate of your products to better understand which products are performing better and which ones need to be improved.
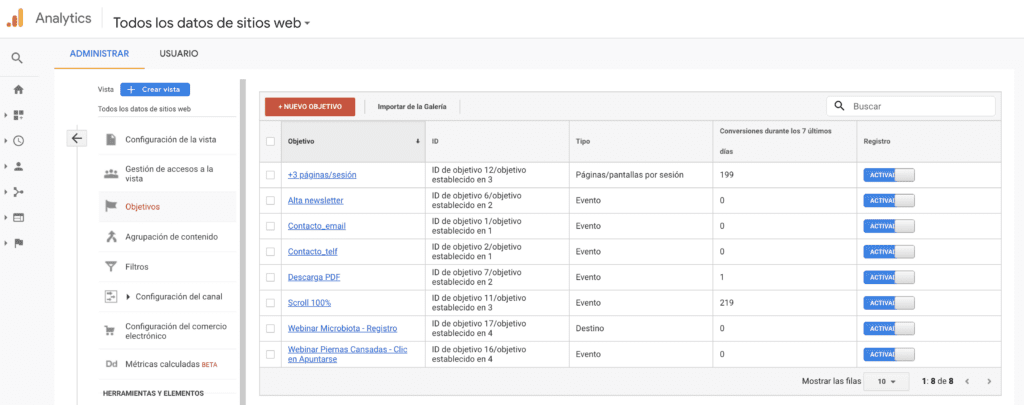
Step 1: Set up a conversion goal first. You need to set up a conversion goal in Google Analytics so that you can measure the conversion rate of your products. To do this, go to the “Admin” tab in Google Analytics and select “Goals” in the “View” section. Next, click on the “+New Goal” button and select “Buy” as the goal type. Configure the goal details accordingly and click “Create Goal” to save it.
Step 2: Next, you need to set up event tracking in Google Analytics so that you can track user interaction with your products. To do this, you need to add the Google Analytics event tracking code to your website and set up events to track product view, add to cart and purchase. This will allow you to see how many times each product has been viewed, how many times it has been added to cart and how many times it has been purchased.
Step 3: Once you have set up event tracking, you can view e-commerce reports in Google Analytics to analyze the conversion rate of your products. Go to the “eCommerce” section under the “Acquisition” tab and select “Products”. Here you will see a list of your products along with their performance metrics, including conversion rate.
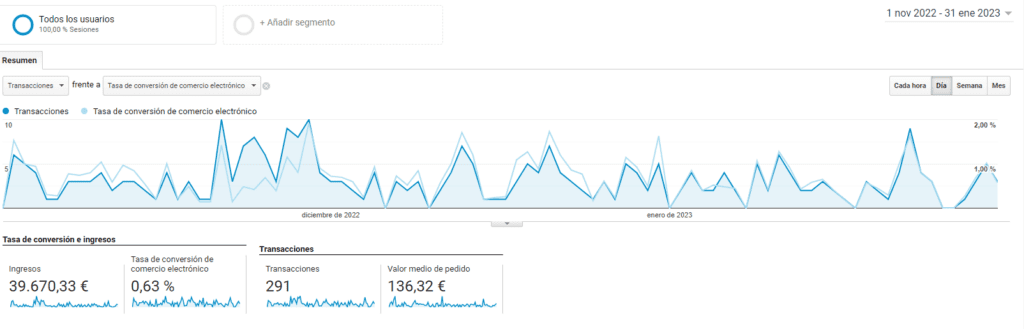
Step 4: Now that you have access to e-commerce reports, you can analyze the data to better understand how each of your products is performing. You can compare the conversion rate of different products to see which ones are performing better and which ones need to be improved. You can also analyze the cart abandonment rate to see if there are problems with the checkout process.
By following these steps, you will be able to set up a conversion goal, set up event tracking, access e-commerce reports and analyze data to make informed decisions on how to improve your products or services and increase sales.
Practical example: Analysis of blog visits
Let’s say you have a blog where you write about fashion and lifestyle topics, and you want to use Google Analytics to analyze traffic to your blog. Here is a practical example of how you can do it:
- Set up a Google Analytics account and add the tracking tag to your website.
- Once the tracking tag is installed, you will be able to view Google Analytics reports. In the Analytics dashboard, click on “Acquisition” and then “All Traffic” to view reports on how users are reaching your site.
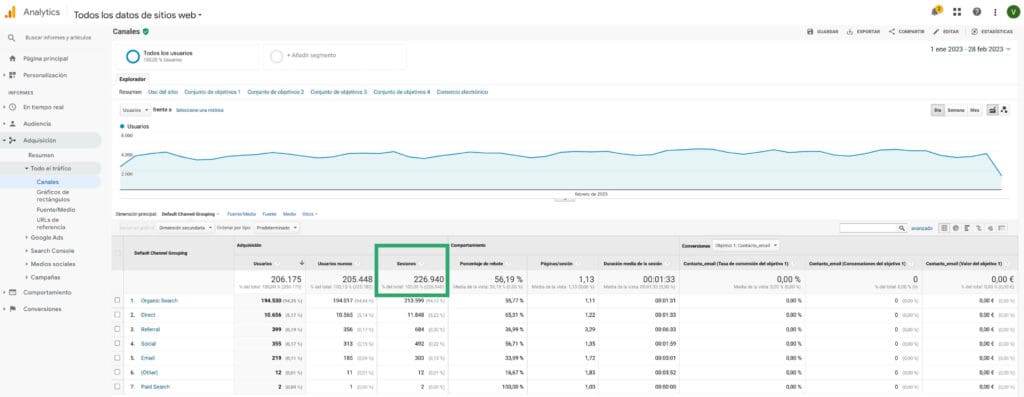
- To see how many visits your blog has had, click on “All traffic” and then “Channels”. This will show you a list of channels that have sent traffic to your website. You can click on the “Organic Search” channel to see how many visits your website has had through organic search results.
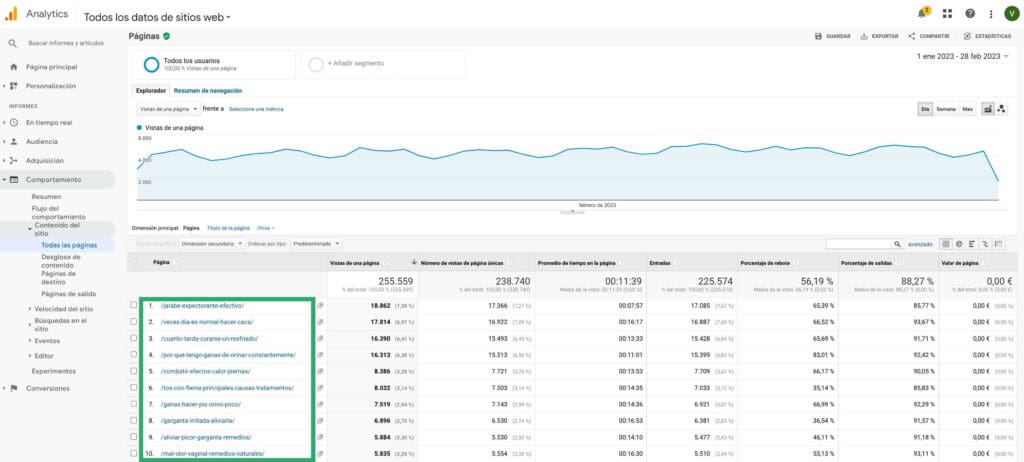
- To see which pages are being visited on your blog, click on “Behavior” and then “Site Content” and then “All Pages”. This will show you a list of the most viewed pages on your website, as well as the amount of time visitors spend on each page.
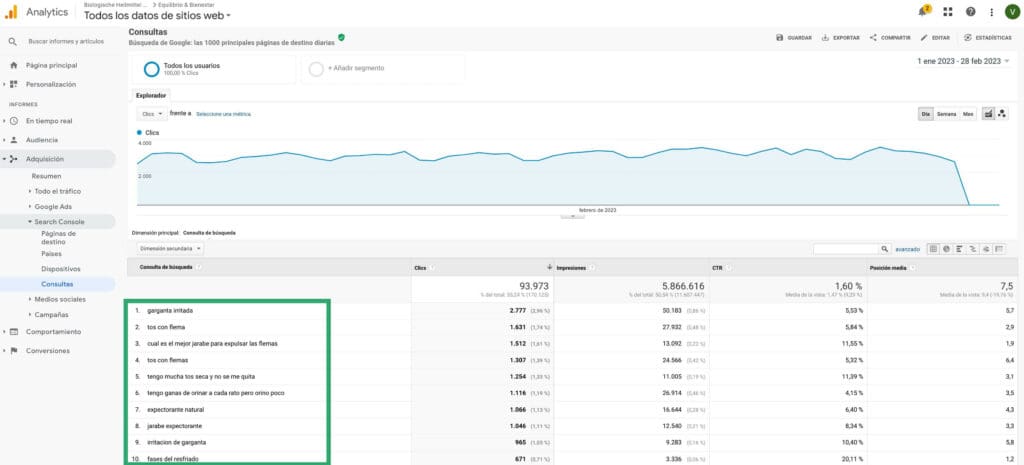
- To see what keywords are being used to find your blog in search engines, click on “Acquisition” and then click on “Search Console” and then “Queries”. This will show you the queries in the Google search engine that have generated impressions to your website and the number of clicks the URLs pointing to those keywords have received.
These are just a few examples of how you can use Google Analytics to analyze visits to your blog. With this information, you can make adjustments to your content and marketing strategy to increase traffic to your blog.
Evaluating campaign effectiveness in digital analytics is critical to digital marketing success. By setting clear objectives, selecting the right metrics, tracking metrics, analyzing data, and making adjustments and improvements, marketers can maximize the impact of their campaigns and improve their overall digital marketing strategies.
At Reinicia we believe that the use of digital analytics is key to digital development, allowing you to optimize your investment in digital communication and business profitability. If you think so too and want to learn more about how analytics can help you in your marketing strategy, watch our webinar on“Analytics for digital marketing: Measure, analyze and improve“.