Index
What are dashboards and why are they important for your business?
The dashboard is a visual tool that allows monitoring and measuring the performance and results of a business in real time. Dashboards usually include a series of key performance indicators(KPIs) that reflect the company’s current situation and trends in different areas, such as sales, finance, marketing, production, human resources, among others.
Its importance lies in the fact that it provides business owners and decision-makers with a clear and quick view of the state of their business, enabling them to identify problems or areas for improvement, and make informed and timely decisions to improve the company’s performance and profitability.
Dashboards are especially useful in dynamic and competitive business environments, where decisions must be made quickly and accurately, and where information is key to achieving a competitive advantage. In addition, they can also help foster transparency and internal communication, as they allow all team members to have a shared and up-to-date view of the state of the company and the objectives to be achieved.
Types of dashboards
The variety of dashboards and the choice of dashboard depends on each company and its specific needs. It is the organizations that determine its structure and choose which indicators are most appropriate to include in it, revealing in the dashboard the most important data to be taken into account in the different areas.
- Balanced Scorecard (BSC): A very common format used to assess the overall performance of an organization. It provides a clear and summarized representation of key performance indicators (KPIs) in categories such as finance, customers, internal processes, and development and growth.
- Financial scorecard: Focuses on the financial aspects of an organization. It provides accurate details about business finances, such as cash flow, revenues, expenses and profit margins.
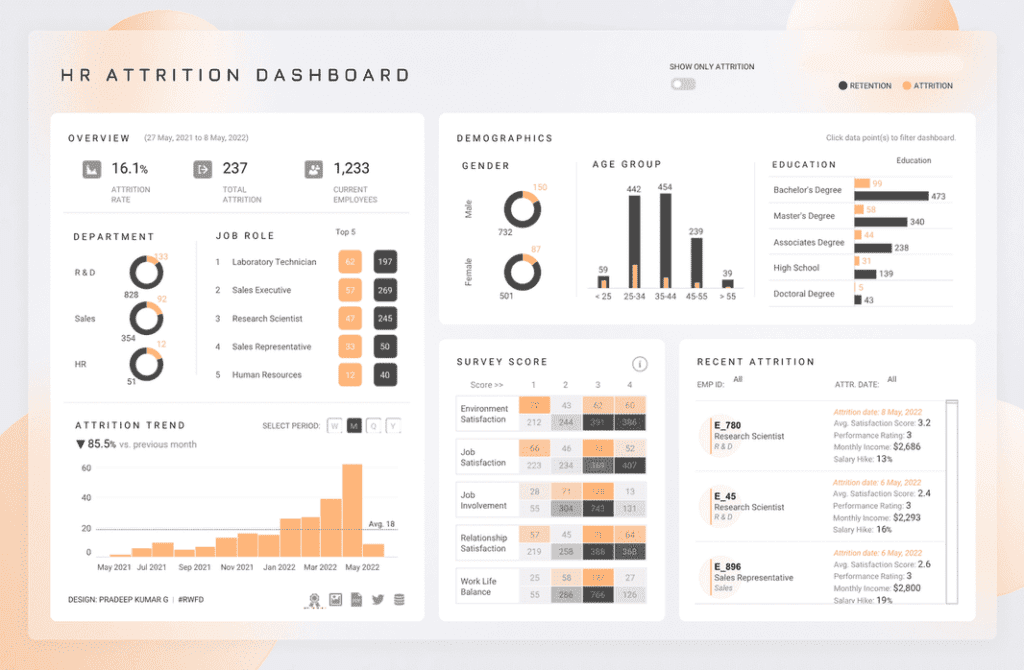
- Human resources scorecard: Used to measure and assess the performance of human capital in an organization. It facilitates the monitoring of indicators such as staff turnover, employee satisfaction, training and development, as well as staff productivity.
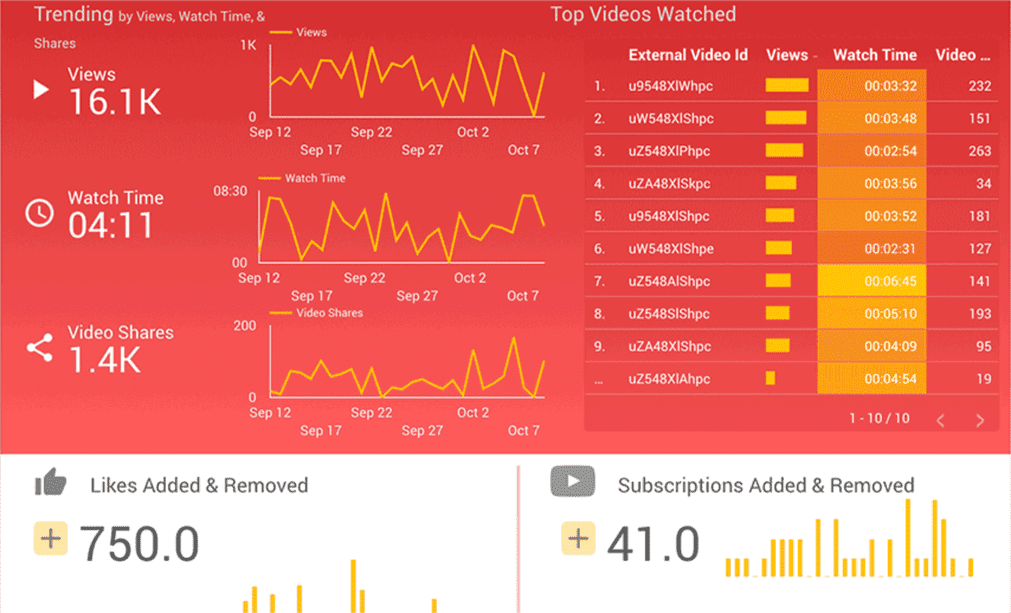
- Marketing dashboard: Used to measure and analyze the performance of a company’s marketing strategies. It provides information on indicators such aslead generation, marketing ROI, brand visibility and customer satisfaction.
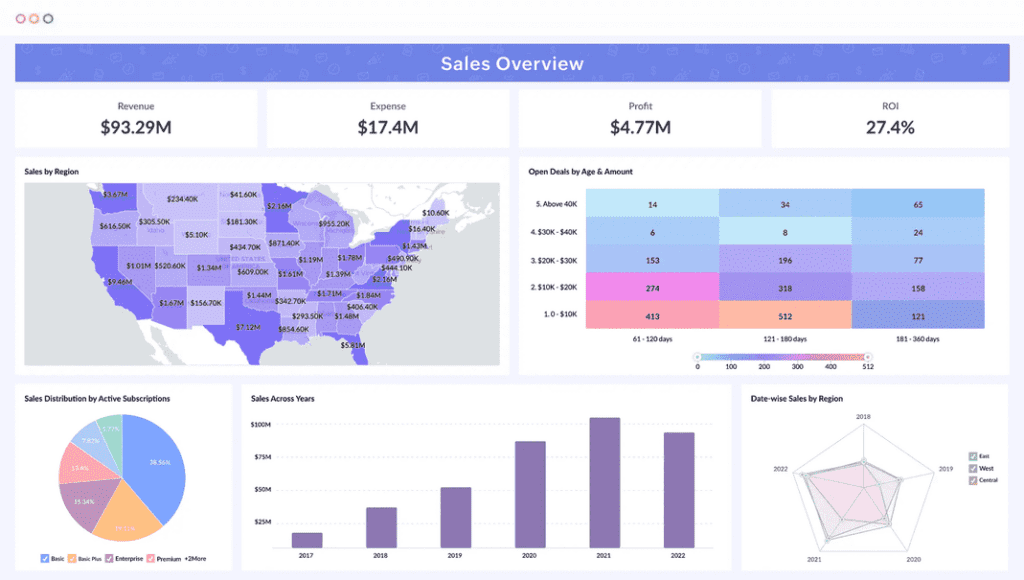
- Sales Scorecard: Used to monitor the performance of a sales team. It facilitates the measurement of indicators such as total sales, sales per salesperson, sales conversion rate and customer lifetime value. It is a valuable tool for sales management and decision making.
In Reinicia we are specialists in Control Panels. We help you!
Technological tools for creating and managing your dashboard
- TableauTableau: is a data visualization platform that allows you to connect and analyze data from different sources, and create customized and visually appealing dashboards.
- Zoho AnalyticsZoho Analytics: stands out for its ease of use and advanced analytics and visualization features. With Zoho Analytics, you can connect and consolidate data from different sources, create interactive visualizations, such as graphs, charts and maps, to track KPIs and measure business performance. In addition, it also offers advanced analytics features, such as data segmentation, value comparison, trend tracking and anomaly detection.
- Looker Data Studio (formerly Google Data Studio): this free reporting and data visualization tool from Google allows you to create customized dashboards and share them with other users.
- Klipfolio to create customized dashboards and automate the collection and analysis of data in real time. KPI management platform that allows you to
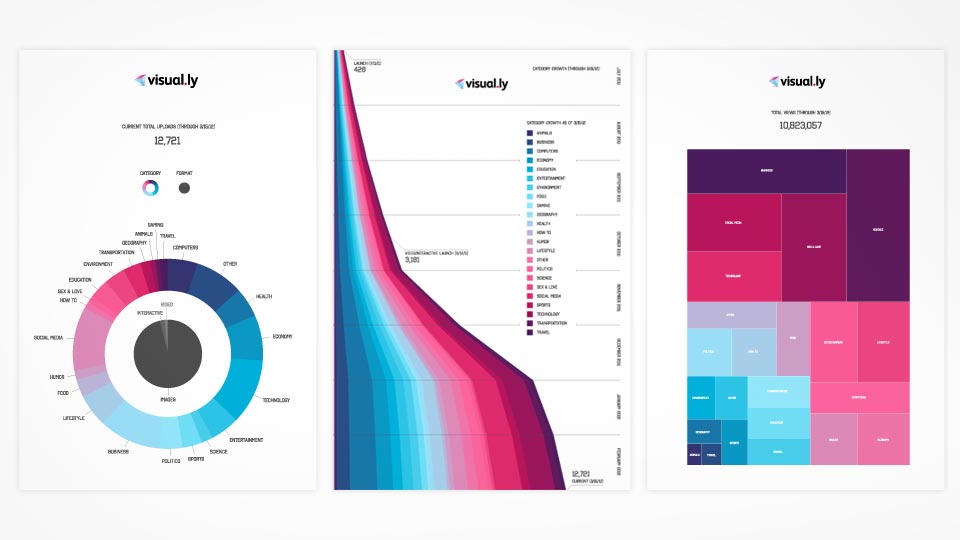
- VisuallyVisually: offers the possibility of including different types of content, such as videos, infographics and presentations, for a richer and more interactive experience. It also allows you to measure the user experience on the website or application, which can help identify areas for improvement and make informed decisions.
These tools can help you identify patterns and trends in data, and make informed decisions to improve business performance.
Watch the webinar Dashboards for business and marketing!
How to select the right KPIs for your business
Selecting the right key performance indicators (KPIs) is crucial for any business, as they allow measuring the performance and effectiveness of the processes and strategies implemented. However, choosing the right KPIs can be challenging, as they must be aligned with business objectives and relevant to the business in question.
KPIs in Organic Social Networks
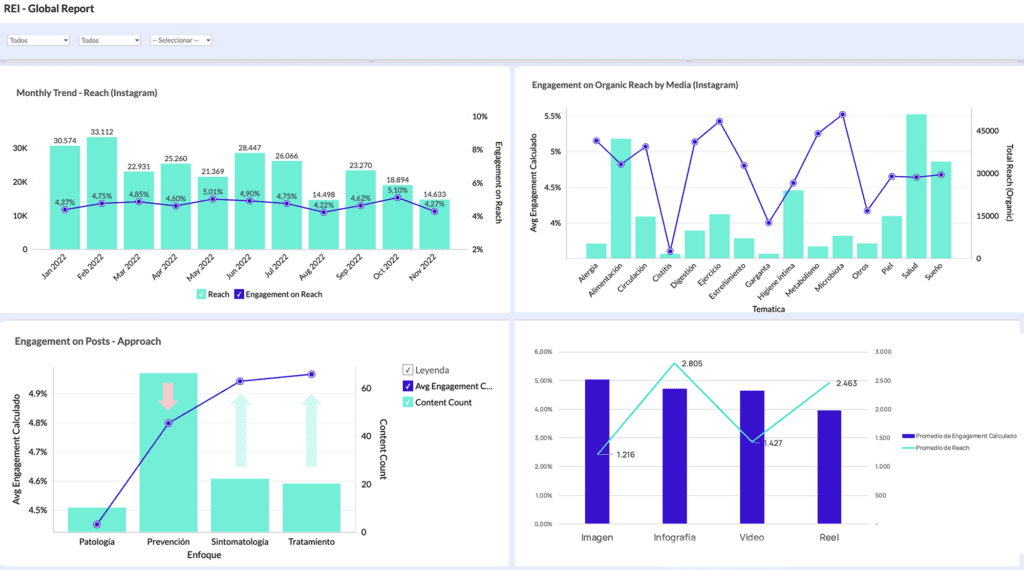
- Reach: This KPI measures the number of people who have seen your posts. Reach allows you to evaluate the impact of your publications and adjust them as needed.
- Engagements: Number of interactions that users have had with your publications, such as Likes, Comments, Shares, Saves and more. Engagement will let you know the attractiveness of your publications and the quality of your content.
- Impressions: Number of times your post is displayed on users’ screens. Impressions indicate the reach of your posts and the effectiveness of your posting strategy.
- CTR (Click-Through Rate): Click-through rate of your posts in relation to impressions. A high CTR indicates that your posts are relevant and attractive to your audience.
- Comments: Number of comments you receive on your posts. Comments evaluate the quality of your content and the interaction with your audience.
- Followers: Number of followers you have on your social media profiles. This KPI measures the growth of your audience and the loyalty of your followers.
KPIs in Google Ads
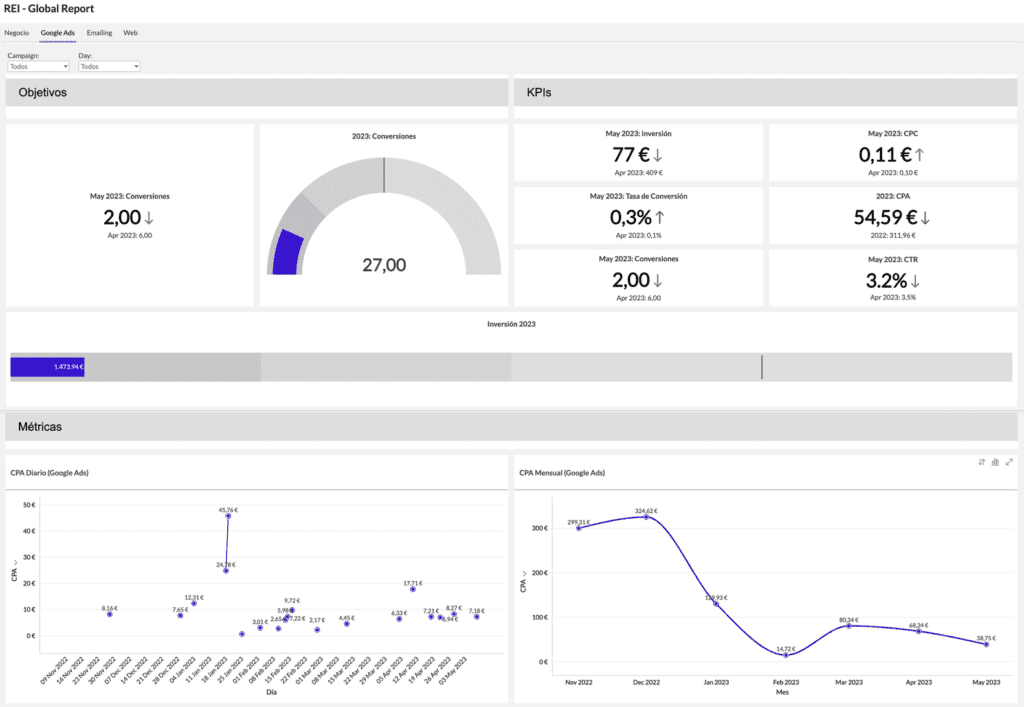
- CTR (Click-Through Rate): Click-through rate of your ads in relation to impressions. A high CTR indicates that your ads are relevant and attractive to your audience.
- CPC (Cost per click): Average cost you pay per click on your ads. A low CPC indicates that your ads are effective and profitable.
- Conversions: Number of times users perform a desired action after clicking on your ads, such as purchasing a product or subscribing to a service. Conversions allow you to evaluate the performance of your ads and adjust them as needed.
- CPA (Cost per acquisition): Average cost you pay per conversion. A low CPA indicates that your advertising campaigns are effective and profitable.
- Impressions: This KPI measures the number of times your ad is displayed on users’ screens. Impressions determine the reach of your ads and the effectiveness of your publishing strategy.
- ROAS (Return on Ad Investment): Revenue generated for every dollar you spend on advertising. A high ROAS indicates that your advertising campaigns are effective and profitable.
KPIs in Email Marketing
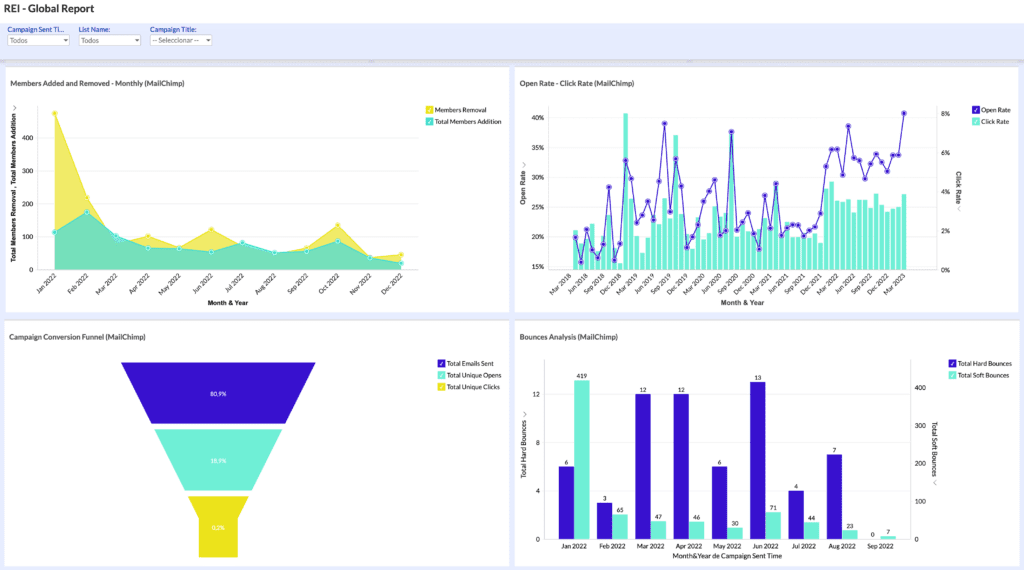
- Open rate: Number of people who open your emails. The open rate determines the effectiveness of the subject line and the quality of your database.
- Click-through rate: Number of people who click on the links in your emails. The click-through rate allows you to evaluate the quality of your content and the interest of your audience.
- Conversion rate: Percentage of people who perform the desired action after clicking on your emails, such as purchasing a product or subscribing to a service. The conversion rate gives clues to the effectiveness of your calls to action (CTAs) and adjust your mailings accordingly.
- Bounce rate: Emails that were not delivered correctly due to an incorrect or invalid email address. The bounce rate is a data that can guide you on the quality of your contact list and make a cleaning if you consider it necessary, for example.
- Unsubscribe rate: People who opt out of receiving your emails. The unsubscribe rate refers to the relevance and quality of your content.
Steps to design an effective scorecard
Designing an effective scorecard can be a challenging process, it takes time and effort, but it can help you gain a better understanding of your company’s performance and make informed decisions to improve your business strategy. Here are 4 essential steps to designing an effective scorecard:
- Identify key objectives: The first thing to do is to identify your company’s key objectives. These objectives should be specific, measurable, achievable, relevant and time-bound. These objectives will help you determine the key performance indicators (KPIs) to include in your scorecard.
- Select KPIs: Once you have identified your key objectives, select the KPIs that will allow you to measure your company’s performance against those objectives. Make sure your KPIs are clear, relevant and measurable.
- Create effective visualizations: The design of visualizations in your dashboard is important, as they should be clear, easy to understand and actionable. Visualizations can include graphs, charts and other types of visual representations of data.
- Monitor and adjust: Once you have created your scorecard, it is important to monitor your KPIs and visualizations regularly. This will allow you to make adjustments and improvements as needed to ensure that your scorecard remains effective and relevant as your goals and strategies change.
Advantages of using a balanced scorecard in your company
The implementation of the Balanced Scorecard (BSC) brings several advantages to companies that adopt it in their operations:
- Provides a global perspective. By gathering information from different perspectives, the BSC allows the most representative characteristics of the company to be observed as a whole.
- Provides detailed knowledge about the organization. The information analyzed accurately describes the current situation of the company.
- It facilitates the control of the company’s evolution. Thanks to indicators and continuous monitoring and analysis, it is possible to foresee future consequences, act to avoid or minimize risks, and correct deviations.
- Aligns strategic objectives with those of each sector or department, ensuring that all efforts converge towards the same goal.
- It favors the communication of the strategy to be implemented and, therefore, its execution. Effective communication is critical to the successful implementation of the BSC. All members must be familiar with the strategies to be implemented and collaborate in achieving the objectives.
- Stimulates employee motivation and involvement. By involving them in the whole process, employees feel an integral part of the process and are more motivated.
How to use your dashboard to make real-time strategic decisions
- Make sure that the KPIs selected are relevant and aligned with the organization’ s objectives. This way, you will be able to measure the performance of critical processes and be aware of any deviations.
- Make sure your data is up to date and accurate. KPIs are based on data, so if the information is not accurate or is outdated, you will not be able to make effective decisions.
- Use graphs and visualizations to present data clearly and concisely. This will allow you to identify patterns and trends more easily and quickly.
- Set up alerts to notify you of any deviations or problems that require immediate attention, so you can act quickly and prevent problems from becoming crises.
- Encourages collaboration between teams so they can make informed decisions and work together to achieve organizational goals.
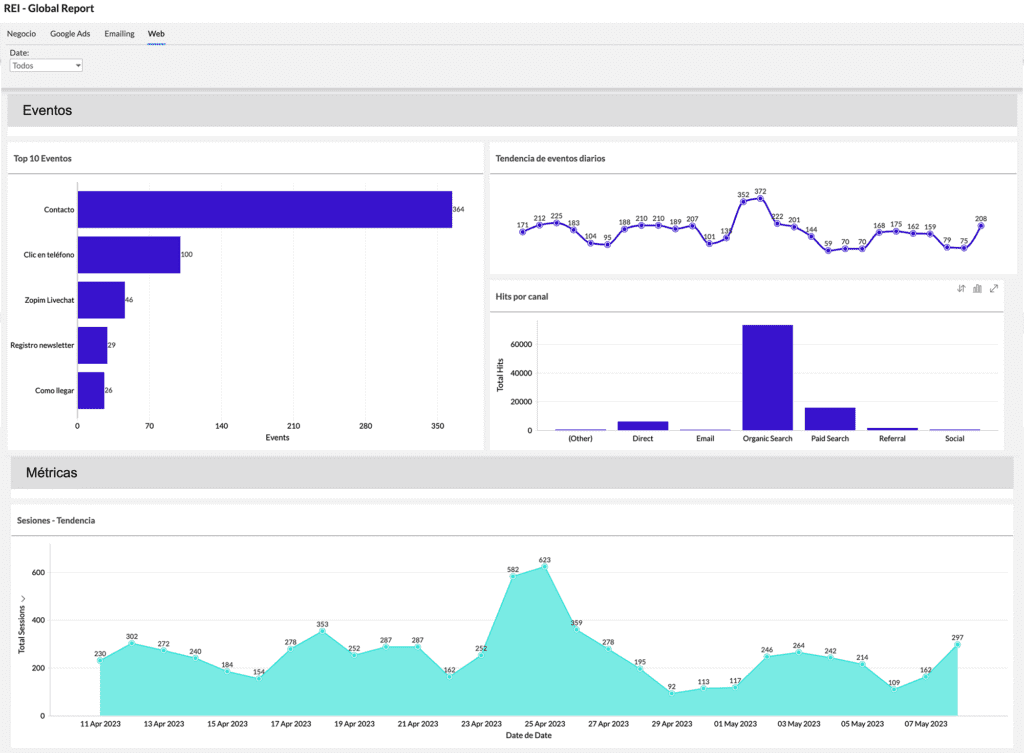
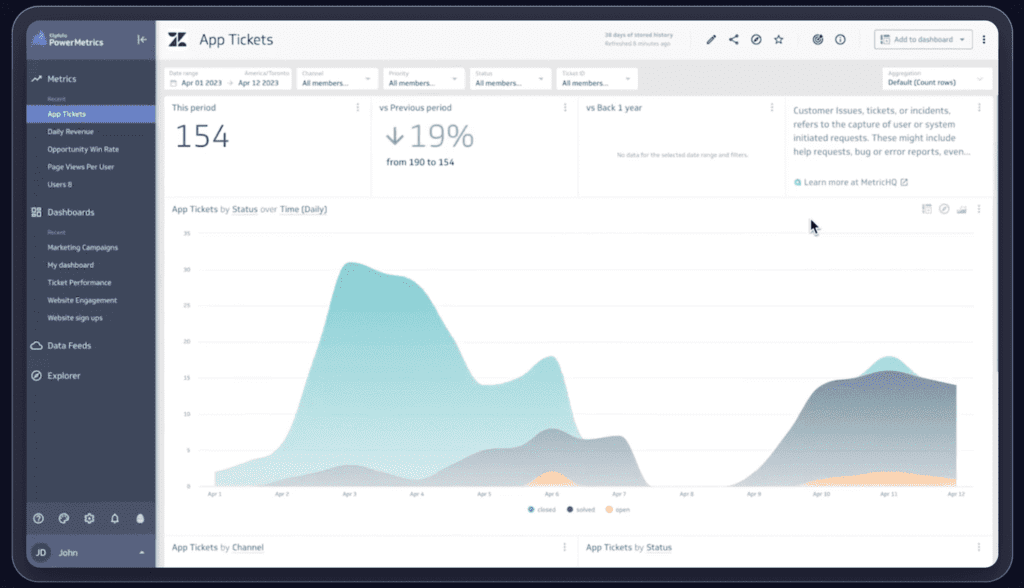
This Zoho Analytics dashboard that we see in the image is connected to a customer’s Google Analytics account.
If you look at the first graph on the left, you can see that the best performing event is the contact form and the newsletter form is the worst performing. Let’s say, for example, that one of the main objectives of the business was to attract subscribers to the blog. In such a case, you should take action.
You would probably start with an internal team meeting to determine SEO improvements or a specific advertising campaign to try to improve search engine positioning and visibility. This way you would have more chances of attracting new customers. In addition, not only would you boost the results for that event configured in Analytics, but you could take advantage of it to impact that database with retargeting of your advertising campaigns and improve the results of visits from Paid Search (as you can see in the second graph on the right of the image).
As you can see, by using your scorecard effectively, you will be able to make strategic decisions in real time and maintain constant control over your business performance.
With a proper selection of KPIs, you can have a better visibility of your business results and make informed decisions to achieve long-term success. Therefore, we would like to invite you to the workshop“Scorecards for business and marketing” that we are organizing next Wednesday, June 21 at 17:30h in Madrid. Don’t miss it! We are waiting for you 😉.