There are many tools that you use to carry out your marketing strategy and implement SEO campaigns, PPC, email marketing or social media strategies and in which you can then see the results independently: Google Analytics, Mailchimp, Twitter, Facebook, Google Adwords, LinkedIn, MOZ and a long etcetera. Not to mention the CRM where you will be managing the contacts obtained to follow up on opportunities: Salesforce, Zoho and Oracle for example. The best way to draw conclusions from the data they offer us in a short time is to gather all of them in a single document in which, periodically, they can be consulted and compared. But this document has to be updated, and to do so, you have to go tool by tool, looking at all of them and dumping the data… Until now, it was normal to centralize it in some Excel or Google Sheets where, in one way or another, the data from all of them were dumped.
Fortunately, tools such as Klipfolio, a platform that allows you to centralize data from different marketing sources in a single dashboard without having to consult them separately, are emerging.
Its great usefulness is unquestionable and you can get a lot out of it. But before setting it up, you need to follow some basic steps to get your company’s analytics in order:
- Define a Measurement Plan.
- In the preparation of the Measurement Plan, the relevant KPIs will be selected for the control of the plan as well as the objectives.
- With this information, you will be able to assemble the scorecard, either a single general scorecard or several scorecards by departments or business units.
With this ready, you can start configuring Klipfolio well and get the data displayed as you want and need. We’re not going to lie to you: it’s not easy to use and the learning curve is high, but you will get simple, dynamic, complete and very visual dashboards.
Add your first Klip in Klipfolio step by step
The Klips Gallery or Klip Gallery
The first thing to know about Klipfolio is that dashboards are made up of klips, which are nothing more than elements in which to group the data you want to display on your dashboard.
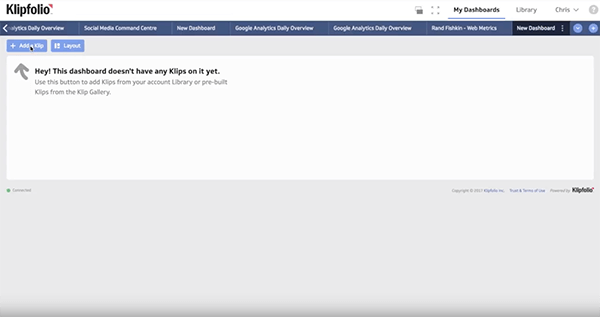
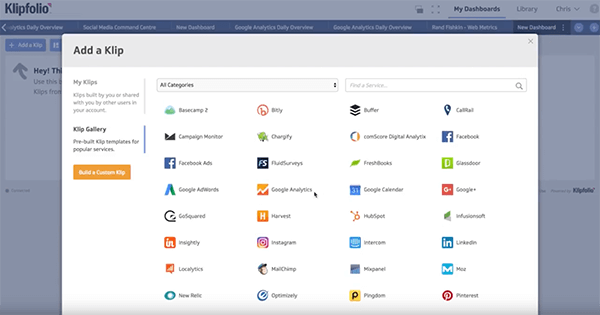
The klips gallery is Klipfolio’s library of ready-made klips that are ready to connect to dozens of web tools so you can easily start visualizing data on your dashboard.
A pop up window will appear with all the tools you can synchronize Klipfolio with such as Google Analytics, Google Adwords, Facebook, MOZ, Mailchimp, etc.
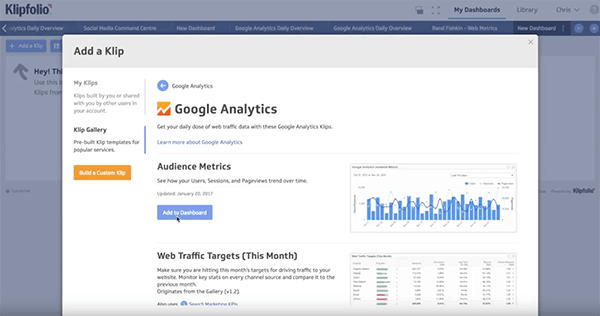
We work with Google Analytics
After clicking on the previous screen, we will get a visualization of different predefined data. They are preconfigured and ready to be updated once you give the tool permission to access your Analytics data. Adding these klips to your dashboard is easy: click on the blue Add to your dashboard button.
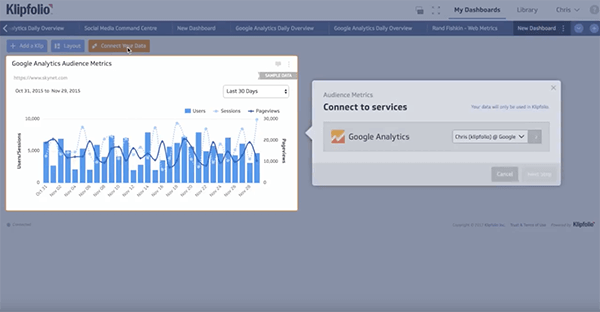
A new window will pop up in which you must give Klipfolio permission to enter Analytics. Add your credentials at that time or click on Connect Later to do it at a later time (but then you will be working with sample data until you do so).
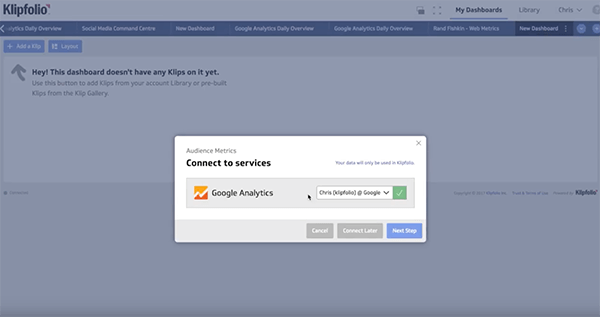
We choose connect later for this tutorial and then a new pop up window tells us that everything is ready. Once you have made your dashboard and you want to move on to see the actual data and connect both accounts, press the orange button in the top left area, Connect your data. Another window will pop up where you will have to follow the steps to make this connection.
If you manage several pages and their data from your account, a drop-down menu will appear in which you must indicate which account and pages you want to connect to:
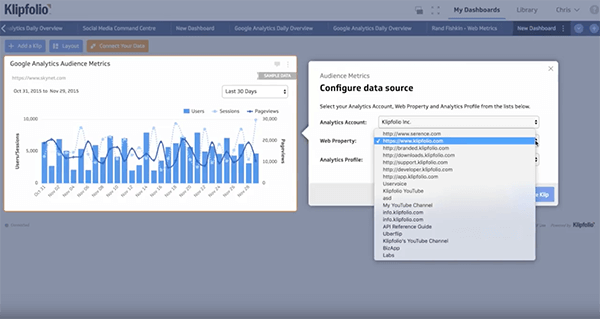
And that’s it! Klipfolio will reflect your data. You have just added your first klip.
Our recommendation is to browse all available applications and see what formats are offered or try to create your own.

We know that managing Klipfolio is complicated. Do you want us to do it for you? At Agencia Reinicia we are Official Klipfolio Partners and we know how to prepare the best custom dashboards to show everything you need to know.